In today’s digital age, software plays an important role in nearly every area of life. From mobile apps to business management systems, from medical devices to space control systems, software has become the backbone of modern products and services. However, software quality issues have emerged as a significant concern, with a Synopsys report estimating a staggering cost of $2.41 trillion due to software quality problems in the United States by 2022.
To ensure quality and mitigate risks, software testing plays a pivotal role. According to Global Market Insight, the software testing market is steadily growing, with an expected annual growth rate (CAGR) of 5% from 2023 to 2027. Quality Assurance (QA) is becoming increasingly prominent in development budgets, with an anticipated allocation of approximately 40% of total costs.
In measuring software testing quality, there are seven primary metrics considered crucial for assessing software testing effectiveness. By monitoring and analyzing these metrics, organizations can gauge the efficacy of the testing process, identify issues, and pinpoint areas for improvement, ultimately enhancing product quality and reducing risk.
What are QA Testing Metrics?
QA testing metrics are measurement indicators utilized to assess the progress, quality, and performance of the software testing process. The objective of these metrics is to enhance performance and efficiency in software testing, aiding in informed decision-making for subsequent testing phases by furnishing reliable data about the testing process.
Why are testing metrics important?
Testing metrics offer valuable insights into a project’s software testing process. These metrics help managers gauge testing effectiveness by addressing key questions:
- What is the duration of the testing phase?
- What are the budget and expenses allocated for testing?
- How critical are the defects found in the product?
- How many bugs has the testing team identified?
- How many bugs have been resolved?
- What is the rate of missed bugs during testing?
- Is testing on track to be completed before product launch?
- How many new features should be incorporated into existing products?
- Can additional tests be conducted within the same timeframe?
The purpose of employing testing metrics is to assess the performance and quality of the software development or testing activities. These metrics enable comparison of current project metrics and outcomes with established standards or best practices, facilitating performance evaluation, pinpointing areas for enhancement, and establishing future quality benchmarks.
- Identifying areas for refining testing processes to attain optimal software quality. Establishing realistic and attainable quality objectives based on industry norms or best practices.
- Establishing realistic and attainable quality objectives based on industry norms or best practices.
- Monitoring progress and evaluating effectiveness throughout the testing phase.
- Leveraging metrics for benchmarking against competitors, enabling organizations to gauge their market position.
- Assisting management in making well-informed decisions regarding project planning, designing strategies, and estimating costs.
Types of Software Testing Metrics
Software testing metrics come in two types: quantitative and qualitative.
Quantitative Metrics
Quantitative metrics measure specific aspects, such as the number of defects discovered, test cases executed, or coverage percentage.
Qualitative Metrics
Qualitative metrics evaluate the effectiveness and quality of processes and products. They involve analyzing data trends, patterns, and relationships to glean meaningful insights.
Key Indicators
The following testing metrics in software testing are absolute values that can be used to generate other metrics. These basic measurement indicators provide an overview of the testing process and software quality, from which project managers can make the best reports and decisions for testing.
- Defect Density: Indicates the number of defects found per test case.
- Total Test Cases: Each test scenario corresponds to one test case.
- Test Cases Executed: Number of test cases run at least once.
- Test Cases Created: Number of test cases generated, not yet reviewed or executed.
- Test Cases Reviewed: Number of test cases created, reviewed, and not executed.
- Successful Test Cases: Number of test cases created, reviewed, and executed successfully. The percentage of successful test cases is calculated as (Number of tests passed / Total number of tests performed) × 100.
- Failed Test Cases: Number of test cases created, reviewed, and executed, but errors were detected. The percentage of failed test cases is calculated as (Number of failed tests / Total number of tests performed) × 100.
- Postponed Test Cases: Number of test cases created and reviewed but not executed due to technical or project reasons.
- Total Test Design Time: This metric represents the overall time required to create and draft test cases.
- Total Test Execution Time: This metric denotes the actual duration spent executing tests.
- Number of Bugs Found: This metric tallies the total count of bugs uncovered by testers during the testing phase.
- Number of Accepted Bugs: These are bugs acknowledged and validated by either the developer or project manager. The percentage of accepted defects is calculated as (Defects accepted by the development team / Total number of reported defects) × 100.
- Number of Bugs Eliminated: This metric signifies the disparity between detected bugs and those confirmed by the development team. Percentage of Test Cases Abandoned: This metric measures the ratio of abandoned test cases to the total number of executed tests. It is calculated as (Number of abandoned tests / Total number of tests executed) × 100.
- Number of Critical Bugs: This metric evaluates testing quality by counting the critical bugs identified during testing.
- Number of Bugs Resolved: This metric indicates the quantity of bugs rectified within a specified timeframe. Percentage of Bugs Fixed: This metric illustrates the proportion of reported errors that have been successfully addressed. It is calculated as (Errors fixed / Errors reported) × 100.
- Total Bug Resolution Time: This metric gauges the time and resources expended on resolving bugs to deliver a solution.
- Number of Bugs Discovered After Release: This metric tracks the number of bugs detected subsequent to the software’s release.
Types of testing metrics

Test Coverage Index
The test coverage index measures the proportion of the source code that undergoes testing, ensuring that critical areas of the software receive adequate testing.
Common test coverage metrics include:
- Code Line Coverage: The percentage of code lines executed during testing.
- Branch Coverage: The percentage of conditional branches executed during testing.
- Condition Coverage: The percentage of true/false cases in condition expressions executed during testing.
- Requirements Coverage: The percentage of tested functional and non-functional requirements.
- Integration Coverage: The percentage of tested interfaces, modules, and interactions between system components during integration testing.
These metrics offer insights into testing coverage, pinpointing areas of the source code or requirements that require further testing.
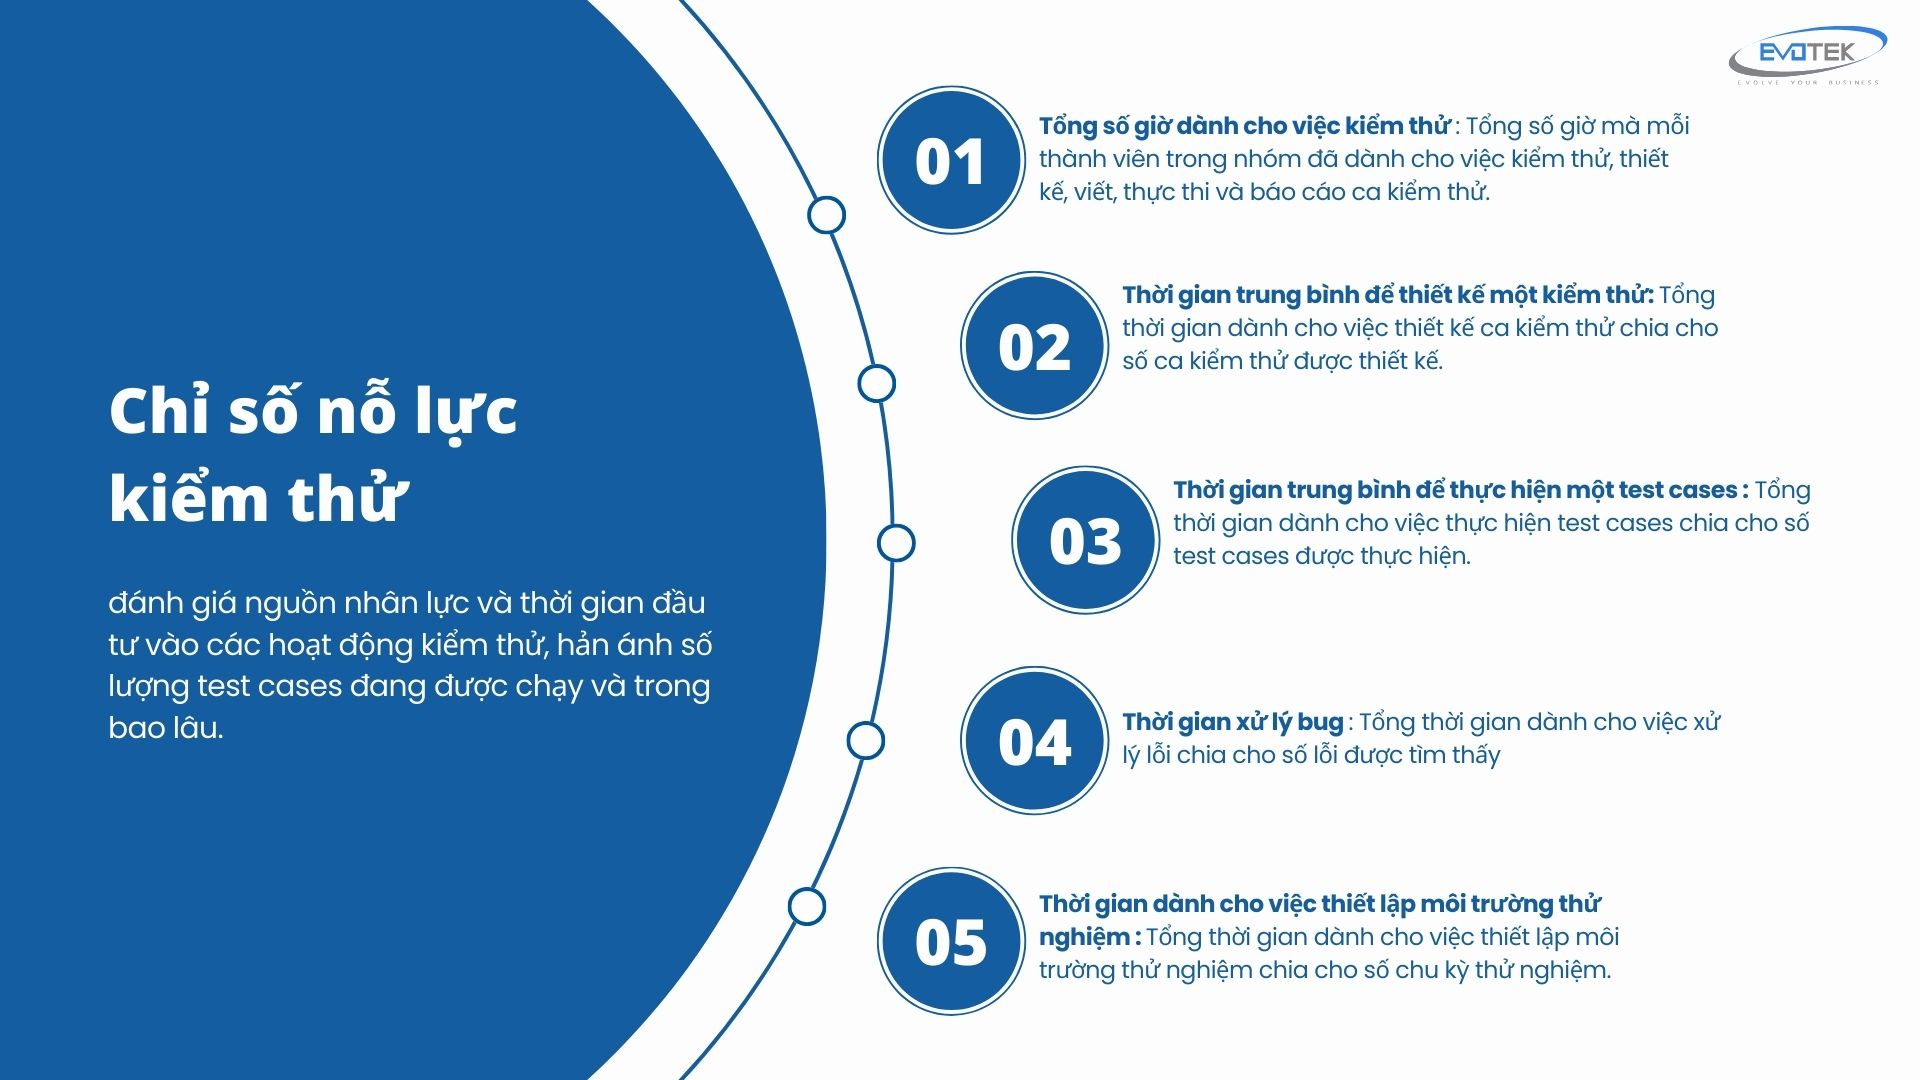
Testing Effort Index
The testing effort index evaluates the allocation of human resources and time dedicated to testing activities, indicating the number of test cases executed and the duration of testing. It facilitates equitable distribution of work among testing team members.

Common metrics to measure testing effort:
- Total Testing Hours: The cumulative hours expended by each team member on testing activities, encompassing test case design, writing, execution, and reporting.
- Average Test Design Time: The total time allocated to designing test cases divided by the number of test cases created, indicating the average duration required to design a single test case.
- Average Test Execution Time: The total time dedicated to executing test cases divided by the number of test cases executed, revealing the average time taken to execute a single test case.
- Bug Resolution Time: The total time invested in resolving bugs divided by the number of bugs detected, providing insights into bug resolution efficiency. Average time taken by the development team to resolve a bug is calculated as (Total time taken to resolve bugs / Number of bugs).
- Test Environment Setup Time: The total time allocated to configuring the test environment divided by the number of test cycles, illustrating the average time required to set up the test environment for each test cycle.
Test Execution Index
Test execution metrics offer an overview of completed and pending tests. Testers often categorize test results as pass, fail, or blocked when documenting them.
Key performance indicators in test execution:
- Number of test cases executed: The total count of test cases run during the testing phase.
- Execution time per test case: The total execution time divided by the number of test cases executed, reflecting the efficiency of test case execution.
- Number of automated test cases: The total count of automated test cases.
- Test case pass/fail ratio: The percentage of test cases that passed compared to those that failed.
- Number of test case iterations: The frequency with which a test case is repeated, indicating its reusability and robustness.
- Test case failure rate: The percentage of test cases that were skipped or left unexecuted during the testing cycle.
These metrics aid in assessing the effectiveness and productivity of test execution, pinpointing areas for improvement or optimization in future testing endeavors.
Bug Distribution Index
The bug distribution index offers a clear picture of how bugs are distributed across various components or aspects of a project.
Common Distribution Metrics Include:
- Number of Bugs per Module/Component: This metric counts the bugs identified in each module or component, aiding in bug prioritization and resource allocation.
- Number of Bugs Classified by Severity: Bugs are categorized by severity, such as very serious, critical, or resolved based on priority. The critical error percentage is calculated as (Fatal errors / Total errors found) × 100.
- Number of Bugs Classified by Function: Bugs are classified by function, such as user interface, database, or security issues, facilitating targeted testing efforts.
- Number of Bugs by Testing Phase: This metric tracks the bugs detected in different testing phases, such as unit testing or system testing.
- Bug Count by Cause: Bug attribution by cause involves categorizing bugs based on their origin or root cause, providing insights into potential areas for improvement.
Bug Detection and Handling Index
The bug detection and handling index gauges how efficiently errors are identified and resolved, ensuring swift bug resolution.
Here are key indicators for detecting and handling bugs:
- Number of Bugs Found per Hour of Testing: This metric measures the rate at which bugs are discovered during testing.
- Average Time to Detect a Bug: The total time taken to identify a bug divided by the number of bugs found provides the detection rate.
- Time Needed to Handle Bugs: Reflecting the efficiency of bug resolution, this metric quantifies the time required to address bugs.
- Number of Retests after Error Correction: Tracking the instances of retesting after fixing errors helps ensure thorough bug resolution.
- Error Recurrence Rate: This metric indicates the frequency at which errors reappear after being resolved, offering insights into the stability of the error resolution process.
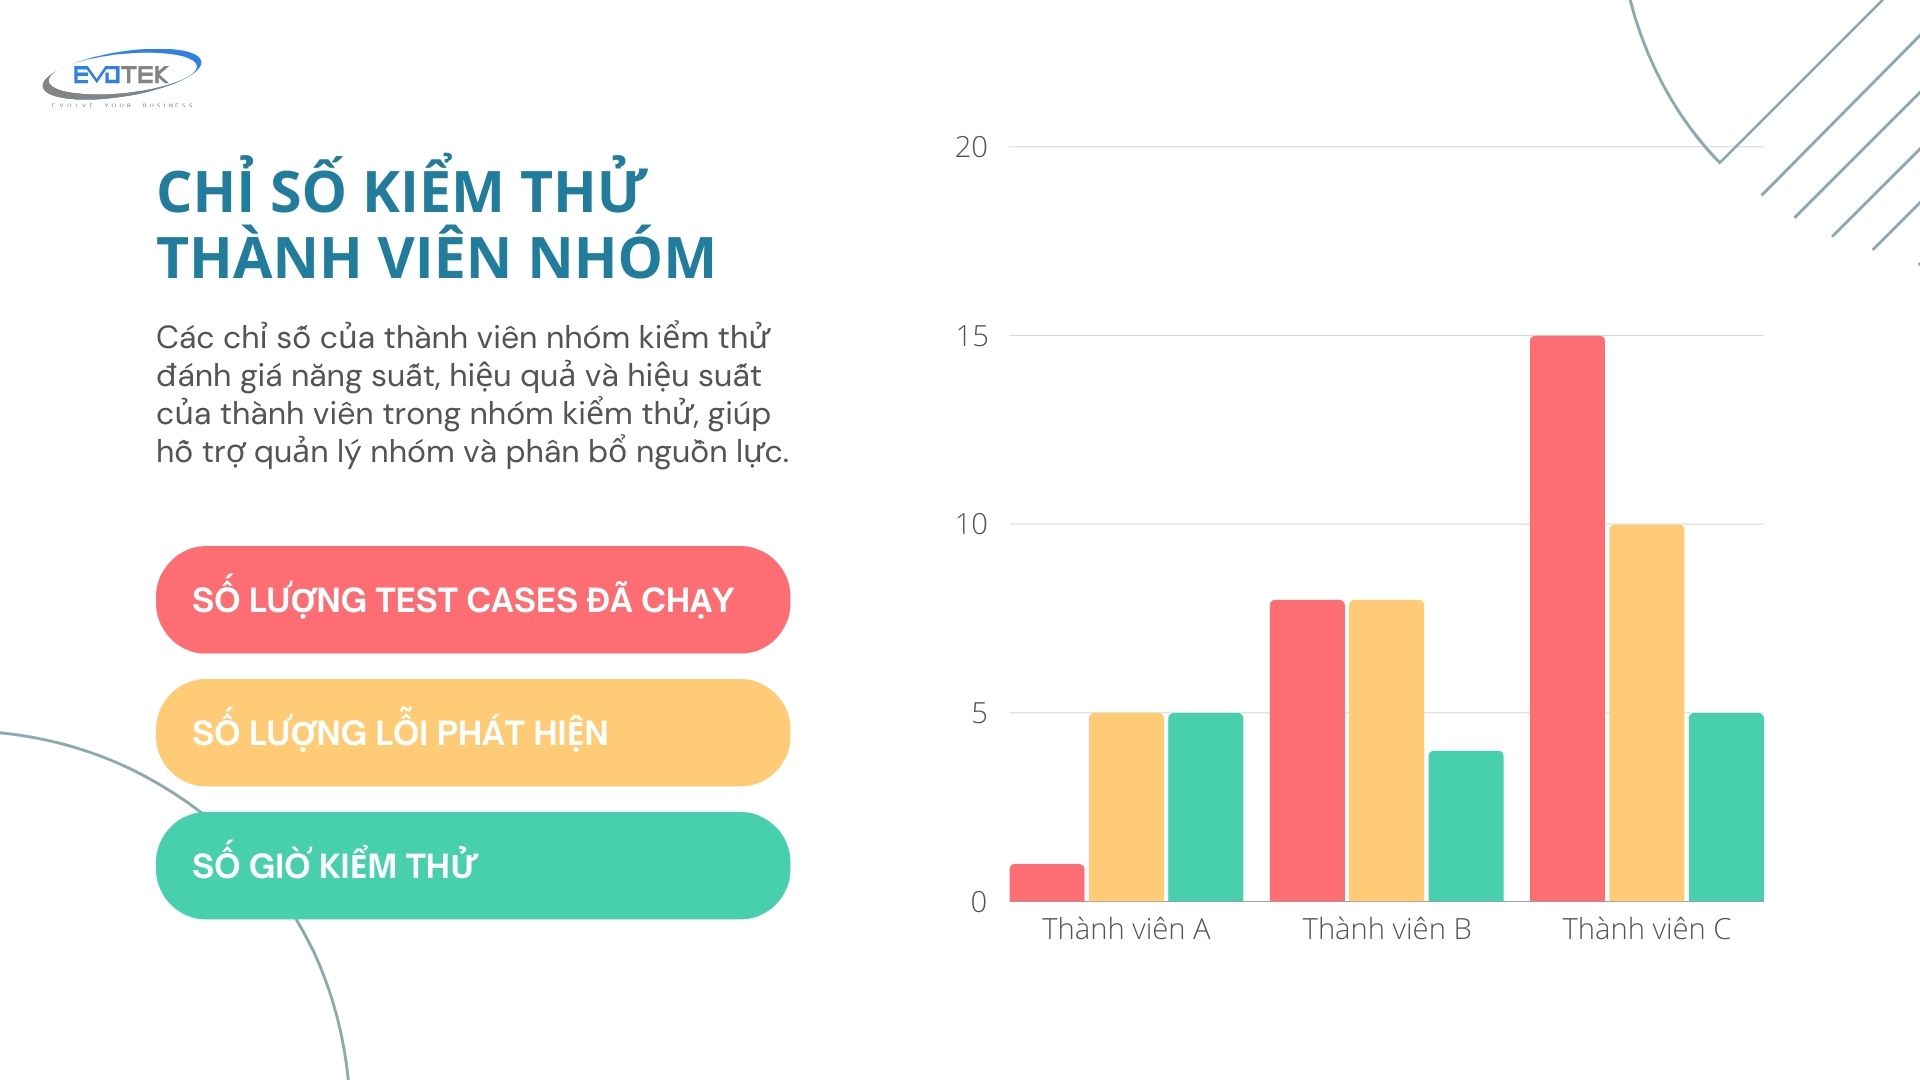
Group Membership Testing Index
Test team member metrics assess the productivity, efficiency, and effectiveness of individual team members, aiding in team management and resource allocation.

Common QA Metrics for Evaluating a Testing Team:
- Number of Test Cases Written: The total count of test cases authored by each team member during testing.
- Number of Defects Detected: The quantity of defects uncovered and reported by each team member during testing.
- Testing Hours: The cumulative hours spent by each team member on testing activities throughout the testing phase.
- Number of Test Cases Run: The total number of test cases executed by each team member during testing.
- Test Case Success/Failure Ratio: The percentage of successful test cases compared to the number of failed test cases for each team member.
- Number of Critical Defects Detected: The count of critical defects identified by each team member during testing.
These metrics assess the testing effectiveness and capabilities of individual team members, identifying high performers and areas for improvement. They also aid in progress tracking and equitable distribution of testing tasks within the team.
Test Budget Metrics
Here are commonly utilized economic metrics for testing:
- Estimated Test Cost: This is the projected cost of conducting tests. It’s calculated by adding up the estimated time required for test execution and multiplying it by the hourly rate of the tester.
- Actual Testing Cost: This is the real cost incurred during testing. It includes the estimated total test execution time plus the total time spent executing tests and playing back recorded actions, all multiplied by the tester’s hourly rate.
- Average Testing Cost per Request: This metric calculates the average cost of testing per individual request. It’s derived by dividing the estimated testing cost by the total number of requests tested.
- Hourly Cost Difference: This represents the variance between the total project cost and the estimated test cost. It helps in understanding if testing expenses align with the overall project budget.
- Cost of Bugs: This figure encompasses the expenses associated with resolving bugs. It’s computed by multiplying the total time spent resolving bugs by the hourly rates of both developers and testers, then summing these costs.
Software Testing with Evotek
Evotek stands as a premier company in the realm of software testing, boasting a team of seasoned professionals and employing advanced testing methodologies. At Evotek, ensuring top-notch product quality is paramount, and the company is dedicated to providing customers with unwavering confidence in their software products.
Quality serves as the cornerstone of all operations at Evotek. The company applies the most modern testing methods, combined with advanced technology and key software testing quality metrics. This helps ensure that every software product is rigorously tested before being delivered to customers.
With a wealth of experience across diverse domains, Evotek recognizes that each software project possesses unique characteristics. Consequently, the experts at Evotek invest time in comprehending customer requirements and objectives, tailoring testing strategies to suit individual needs. This adaptability and client-centric approach establish Evotek as a trusted partner for businesses of all sizes, spanning from startups to established corporations.

 日本語
日本語 한국어
한국어 Tiếng Việt
 简体中文
简体中文